Performance Monitoring in a SAC Story
1 Introduction
In SAP Analytics Cloud (SAC) it is now possible to analyse the performance from inside the story. This short blog gives an overview of how to use the new Performance Optimization tool.
2 How To: Performance Optimization Tool
If the user experiences any performance issues with a story, use SAP built-in quick Performance Optimization Analysis in the Story Builder.
Unfortunately, the user must have the analytic application creator authorization in order to even see the Performance Optimization Tool. So far it is limited to this user group.
In Edit-Mode go to the three dots and on the bottom, there is the Performance Optimization tool available to use.
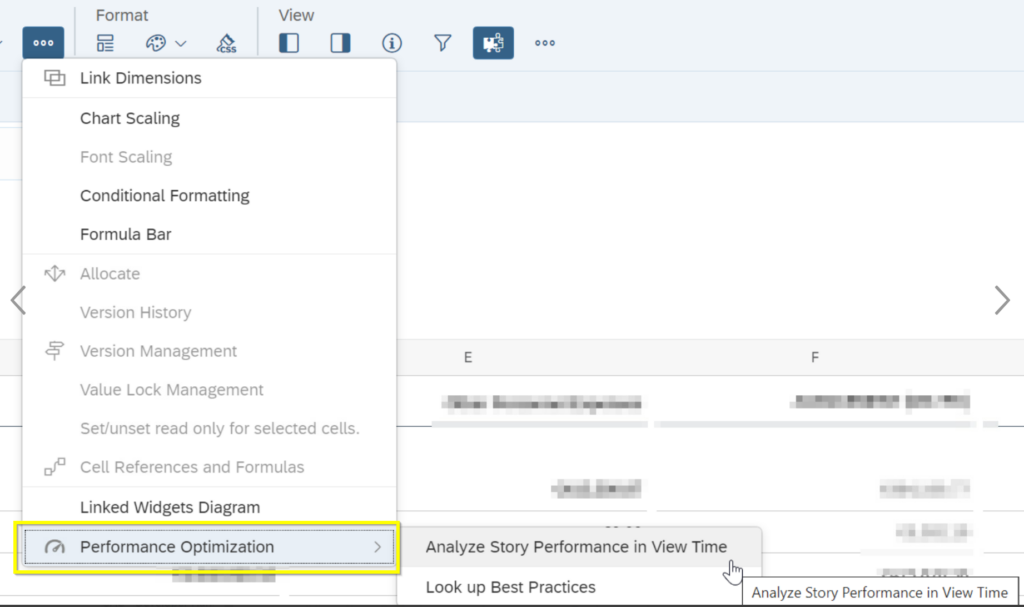
After clicking on “Analyze Story Performance in View Time”, the story opens in a new tab with a modified URL and in view mode.

Click on “Performance Analysis” to open a pop-up with an Insight over the loading time for widgets and how long the browser needed to render the widgets.
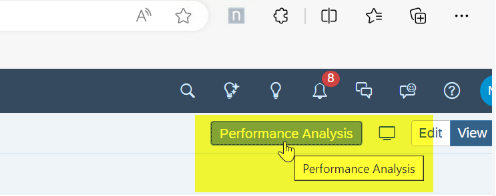
Now the user can see how widget and data go together plus the time to open it.
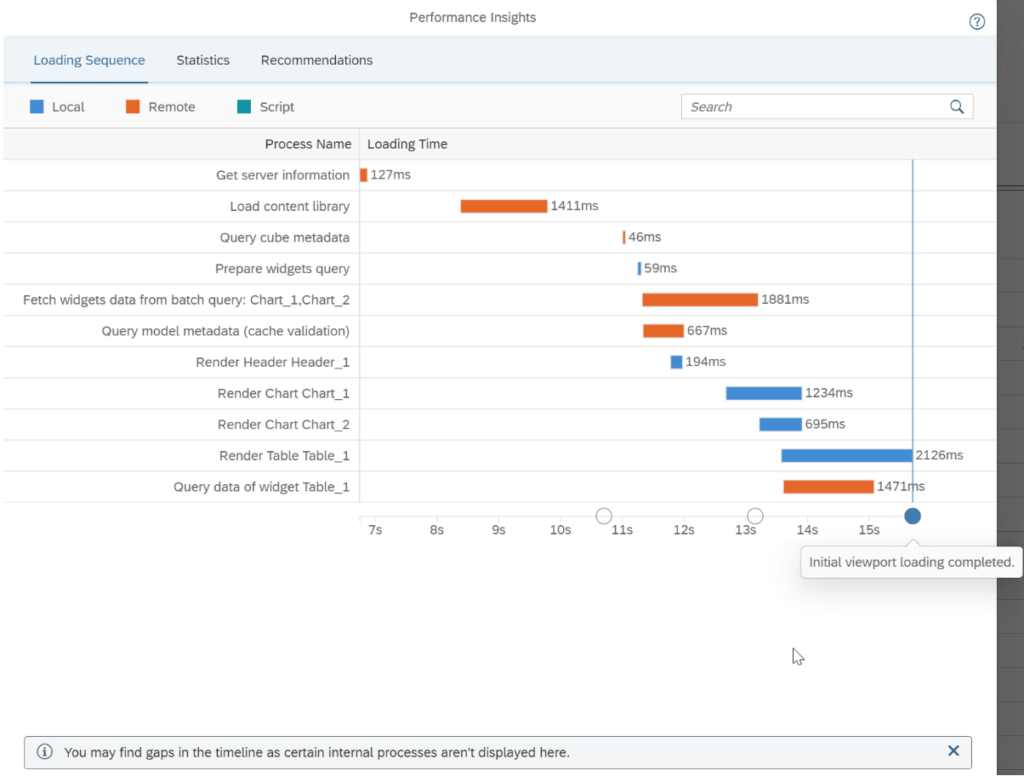
The Loading Sequence shows the time of different processes while the story was loading in view mode.
Local: Shows local processes on the browser itself.
Remote: Data retrieval outside of the browser and other processes that happen outside of the browser.
Script: Refers to the running of Optimized Story Experience API scripts in the browser, which bring dynamic interaction and manipulation with the story elements.
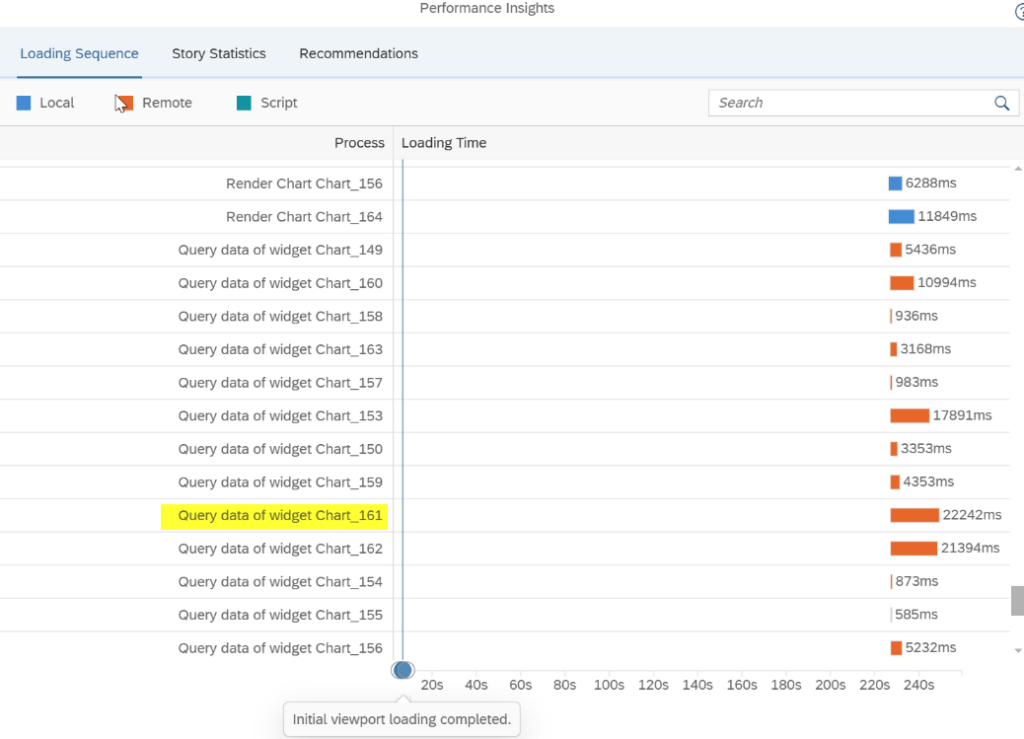
*For more detailed information about the content eg Loading Sequence details go to: https://help.sap.com/docs/SAP_ANALYTICS_CLOUD/00f68c2e08b941f081002fd3691d86a7/f095f8181e604ea2bf66899a69b64d99.html?locale=en-US#check-loading-sequence
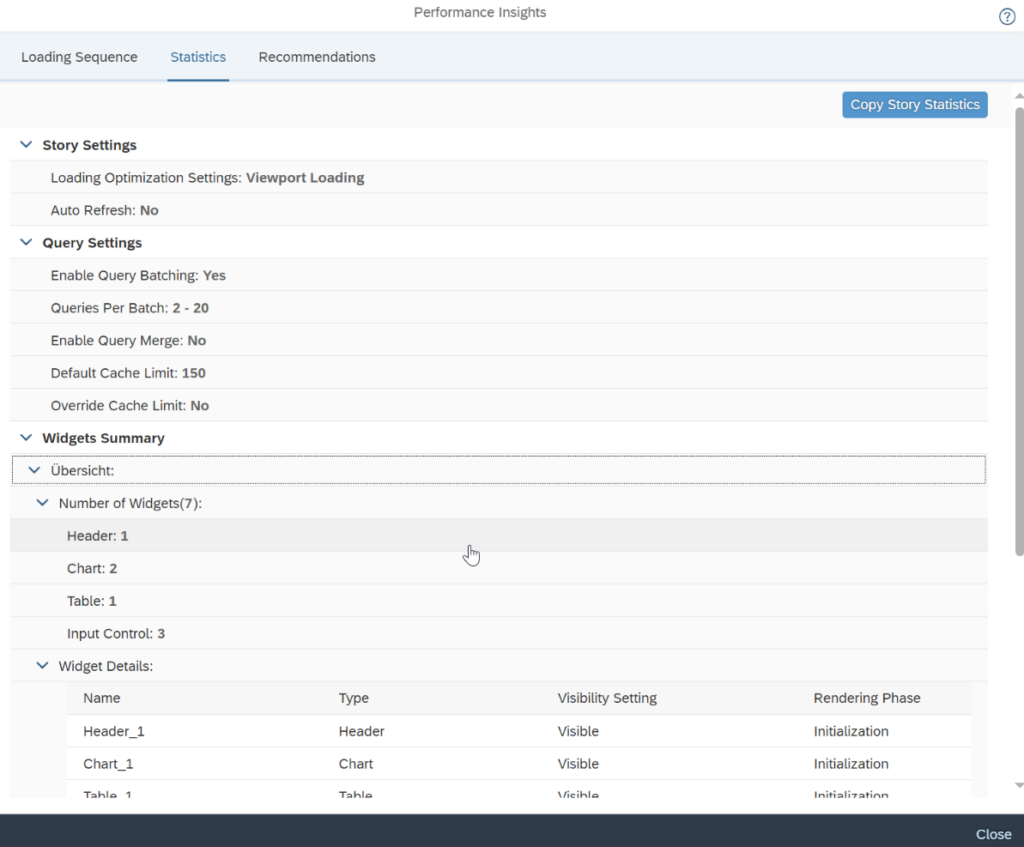
Statistics shows Story and Query Settings in the Story as well as the number of widgets on the page and widget details.
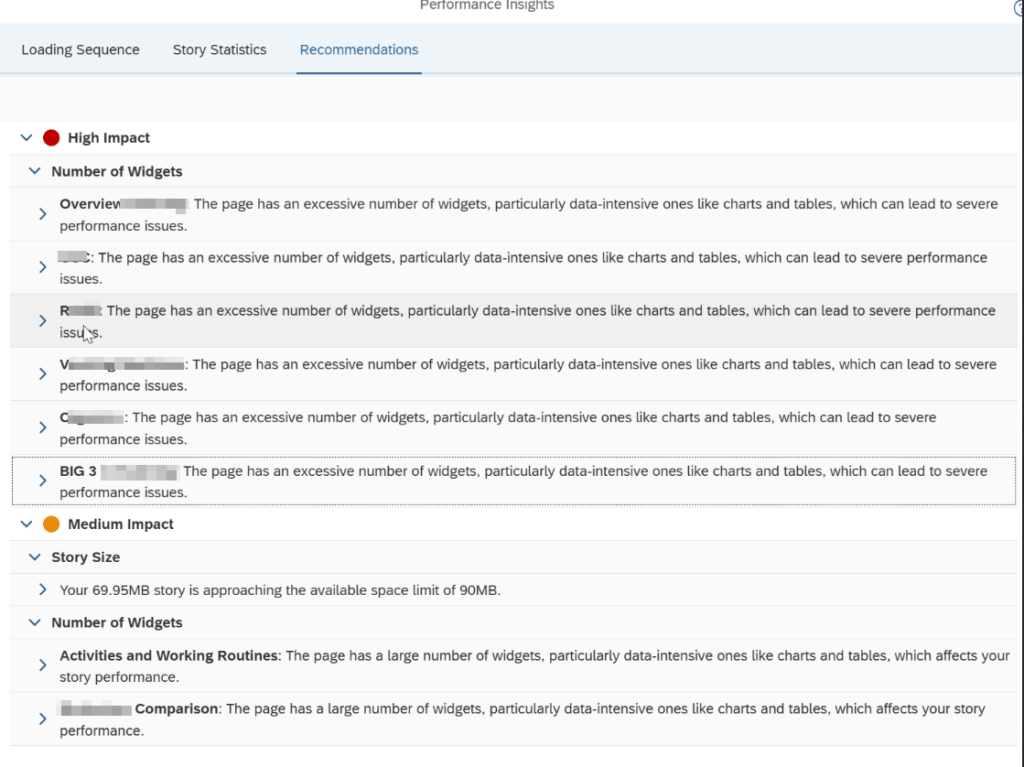
„Recommendations“ Tab shows recommendations for high impact and medium impact pages and their widgets as well as the Story Size (only if it has an impact on performance).
Furthermore, SAP recommends:
- It’s highly recommended to close all other browser tabs for accuracy of the analysis results.
- It’s not recommended to jump to another optimized story in the same browser tab, as the entry to Performance Analysis still exists. To restore to the view mode without Performance Analysis enabled, close the current browser tab.
3 Conclusion
In general, this tool is very useful to pinpoint pages and their widgets (charts, tables, images) which impact the performance of a story. Now the responsible user can re-work the story or go deeper into a backend analysis.
Performance analysis is very important for user contentment with SAC in general. The goal should be to always optimize the story in a way that it loads smoothly and (most important) quickly.

