Generating and Importing Synthetic Sales Data Using ChatGPT, Python and Excel – A Step-by-Step Guide
In today’s data-driven landscape, access to high-quality, varied, and seasonality-aware datasets is crucial for training forecasting models, performing data analysis, and conducting simulations. However, real-world data is often incomplete, unavailable, or limited in scope. This is where generating synthetic data, tailored to specific reporting or forecasting scenarios, comes into play.
Why Use Synthetic Data?
Synthetic data allows businesses to:
- Test systems: Whether for SAP S/4HANA, SAP BW/4HANA, or other data processing platforms, synthetic data can simulate real-world data without compromising sensitive information.
- Speed up development: Rather than waiting for real-time data collection, synthetic data can provide instant datasets for developers and analysts.
- Flexibility: Adjust the datasets to include different variables, sales patterns, or forecast models.
Goal of the Blog
This blog will walk you through how I used Python (via ChatGPT) to generate a synthetic dataset, transferred it into Excel for review and refinement, and imported the CSV output into SAP Datasphere. Along the way, I’ll highlight best practices, challenges, and the tools involved.
Leveraging ChatGPT to get your Dataset
In order to get chat gpt to work with you, the best thing is to ask chatgpt itself, but mostly when generating synthetic sales data, the prompt you give to ChatGPT should define the structure of the data, as well as any specific features like seasonality, trends, product popularity, cross-product relationships, and location-based reporting. Here’s a step-by-step guide on how to include these elements in your prompt.
Define the Basic Structure
Start by specifying the basic variables you want to include in your synthetic sales data. This typically includes:
- Timeframe: Specify the period for which the sales data should be generated.
- Products: List the products you want sales data for.
- Locations/Regions: Specify the geographical breakdown for location-based reporting.
Example: „Generate sales data for five products (Product_A, Product_B, Product_C, Product_D, and Product_E) sold across three regions (North, South, and Central) for a 5-year period (2019-2023) on a monthly basis.“
Incorporate Seasonality
Seasonality plays a critical role in sales forecasting and reporting. For instance, certain products may perform better during specific times of the year, such as holiday shopping seasons or summer months.
Example: „Introduce seasonality, where Product_A has higher sales in the summer months (June to August) and Product_B sees a spike in sales during the winter holiday season (November and December). Similarly, generate data showing regional seasonality, such as North region having a peak in sales in the winter months.“
Include Good and Bad Years
Businesses often experience fluctuations in sales based on economic conditions or other factors. Including good and bad years will help simulate this variability, making the data more realistic for forecasting.
Example: „For 2020, generate a year of low sales across all products and regions, reflecting a ‘bad year’. On the other hand, show 2022 as a year of recovery, where sales increase by 20% for all products.“
Show Product Popularity Trends
Sales data often reflects varying levels of product popularity over time. Some products gain traction and become best-sellers, while others decline. Capture these trends by specifying popularity shifts.
Example: „Include product popularity trends where Product_C shows a gradual increase in sales over the five-year period, becoming the best-seller by 2023. Conversely, Product_D starts strong but sees a decline over time.“
Cross-Product Relationships
Cross-product relationships are important in real-world sales, where the sales of one product can influence the sales of another. For example, promotional bundles, complementary products, or substitute products can lead to correlated sales data.
Example: „Introduce cross-product relationships, where an increase in sales of Product_A leads to a correlated increase in sales of Product_E (e.g., a complementary product), while higher sales of Product_B result in lower sales of Product_D (e.g., substitute products).“
Regional/Location-Based Reporting
For location-based reporting, synthetic data should be generated to reflect regional differences. Some regions may favor certain products over others, and economic conditions could vary by location.
Example: „Incorporate location-based variations, where Product_A performs best in the North region, Product_B sells the most in the South region, and Product_E has steady sales across all regions. Additionally, reflect that the Central region experiences lower sales across all products during the third quarter of each year.“
Product-Specific Seasonality
Seasonality may not apply uniformly across all products. Some products might be seasonal, while others see steady year-round demand.
Example: „Product-specific seasonality should be included, with Product_A peaking in summer, Product_B in winter, and Product_C showing no particular seasonality but experiencing slow growth across all months. Product_E should show spikes during promotional periods, such as Black Friday in November.“
Complete ChatGPT Prompt for Synthetic Sales Data Generation:
„Generate synthetic sales data for five products (Product_A, Product_B, Product_C, Product_D, and Product_E) sold across three regions (North, South, and Central) for a 5-year period (2019-2023) on a monthly basis.
Incorporate seasonality: Product_A has higher sales in summer (June to August), Product_B spikes in sales during the winter holiday season (November and December), while Product_C has steady growth year-round. Product_E should experience significant sales during promotional months (e.g., November).
Introduce good and bad years: In 2020, simulate a ‘bad year’ with lower sales across all products and regions, while 2022 should show a 20% recovery in sales.
Reflect product popularity trends: Product_C grows in popularity and becomes the best-seller by 2023, while Product_D declines over time.
Introduce cross-product relationships: Higher sales of Product_A lead to a correlated increase in Product_E, while higher sales of Product_B lead to a decline in Product_D.
Finally, reflect regional trends: Product_A performs best in the North region, Product_B is the top seller in the South, and Product_E shows steady sales across all regions. The Central region experiences lower sales in the third quarter every year.“
With this prompt you will get something like this:
Python Code:
import pandas as pd
import numpy as np
import random
# Defining the parameters
regions = [‚North‘, ‚South‘, ‚Central‘]
products = [‚Product_A‘, ‚Product_B‘, ‚Product_C‘, ‚Product_D‘, ‚Product_E‘]
date_range = pd.date_range(start=’2019-01-01′, end=’2023-12-31′, freq=’M‘)
# Function to simulate seasonality and trends
def generate_sales_data():
sales_data = []
for date in date_range:
for region in regions:
for product in products:
# Introducing seasonality and trends
seasonality = 1.0
if product == ‚Product_A‘ and date.month in [6, 7, 8]:
seasonality = 1.5
if product == ‚Product_B‘ and date.month in [11, 12]:
seasonality = 2.0
# Good and bad year effects
if date.year == 2020:
seasonality *= 0.7
if date.year == 2022:
seasonality *= 1.2
# Generate sales data based on product, seasonality, and regional performance
sales_volume = random.randint(50, 500) * seasonality
revenue = sales_volume * random.uniform(10, 50)
customer_count = random.randint(5, 50)
sales_data.append([date, region, product, sales_volume, revenue, customer_count])
return pd.DataFrame(sales_data, columns=[‚Date‘, ‚Region‘, ‚Product‘, ‚Sales Volume‘, ‚Revenue‘, ‚Customer Count‘])
# Generate and export the sales data to Excel
sales_df = generate_sales_data()
Checking the data and analyzing in Excel
It makes sense to look at a subset of the data directly in chatgpt to detect some faulty data and ask gpt to correct those issues.
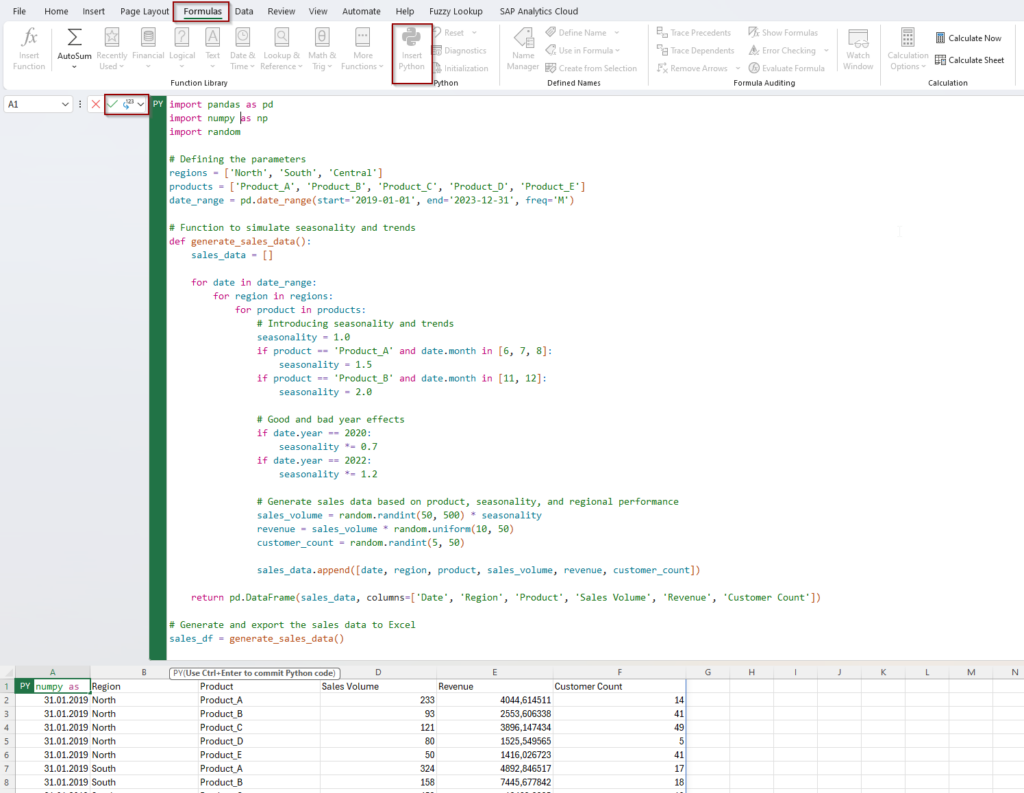
If you are happy with the sample data, then you can go to excel and execute the python code in the formulas tab.
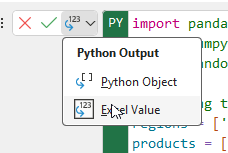
Just enter the python code and adjust the Python Output to -> Excel Values and click on the green arrow.
Final Thoughts
Synthetic data generation using ChatGPT and Python provides a powerful solution for businesses and data professionals in need of realistic, flexible datasets for forecasting, testing, and analysis. This approach allows for the customization of data with seasonality, product-specific trends, and regional variations, mimicking real-world conditions without reliance on sensitive or limited real data.
This guide demonstrates the value of synthetic data for simulating real sales environments, from adjusting for economic shifts to capturing nuanced cross-product relationships. With synthetic datasets tailored precisely to business needs, companies can more effectively test systems, refine forecasting models, and uncover insights that might otherwise remain hidden.
As you experiment further, consider iterating on your prompts and Python code to enhance complexity and accuracy based on evolving requirements. Embrace this iterative process to make synthetic data a reliable foundation for your analytical and forecasting initiatives. Happy data generating!